TimeChainage Project Planning Software
Developed by Peter Milton Planning, TimeChainage is a powerful, value for money project planning application which has been designed to provide all the advantages inherent in the time chainage format, bringing you that extra dimension to your schedules.
With TimeChainage you can:
- Produce great looking time chainage charts that often provide better visibility to others than the equivalent Gantt chart
- Set yourself apart from the competition and improve your chance of winning work (many companies still lack good time chainage software)
- Save time and money on your project planning
- Use TimeChainage to produce project programmes from scratch or use it as a complimentary tool alongside a bar chart application
- Add as-built data as the project progresses to clearly show whether you are improving against or falling behind your plan with a visibility Gantt charts simply cannot match
Design/Feasibility Stage
TimeChainage is ideal for creating tentative project programmes during the design/feasibility phases.
You can work at different levels of detail and quickly produce a variety of options to consider.
The graphical nature of time chainage charts means that your plans are quick to understand and ideal for team reviews.
You can work at different levels of detail and quickly produce a variety of options to consider.
The graphical nature of time chainage charts means that your plans are quick to understand and ideal for team reviews.
Tendering
More and more clients are asking for time chainage charts as part of the tender submission. Even when not required, a time chainage chart produced with TimeChainage demonstrates that your bid has been well prepared.
If submitted with the tender, the time chainage may well be used more by the tender review team than the associated Gantt chart, simply because it is easier to get an overall picture of the project programme and to identify the salient issues. This provides greater confidence in your programme submission and shows your capability to complete the project successfully within the desired time frame.
If submitted with the tender, the time chainage may well be used more by the tender review team than the associated Gantt chart, simply because it is easier to get an overall picture of the project programme and to identify the salient issues. This provides greater confidence in your programme submission and shows your capability to complete the project successfully within the desired time frame.
Construction Phase
Most contracts require a Gantt (bar) chart for the contract programme submission and for progress tracking. However a time chainage chart can be prepared alongside the Gantt chart and used to aid it’s development. It will also provide better visibility to the project team, both for the client and the contractor. It provides real benefits which construction professionals are increasingly understanding and as a result time chainage charts are now often a contract requirement.
On appropriate types of project, TimeChainage can make the Gantt chart all but redundant. This is an amazing feat if you consider the relative costs of industry standard bar chart software versus a TimeChainage license.
On appropriate types of project, TimeChainage can make the Gantt chart all but redundant. This is an amazing feat if you consider the relative costs of industry standard bar chart software versus a TimeChainage license.
Ease of Use
The ease and speed at which a TimeChainage project can be prepared, means that the little extra effort needed to create it will be more than offset by the benefits produced. Use TimeChainage to produce the schedule, or import an existing schedule created with another planning application (such as Primavera P6).
Flexibilty
Change happens, and where there is change, TimeChainage makes incorporating the changes and assessing the impact very quick and easy. TimeChainage can then be used to develop mitigation options. Because of the graphical nature of time chainage charts, the impact of change and advantages and disadvantages of options can often be communicated more effectively than with bar charts.
Different layouts can be produced in TimeChainage to show different aspects of the plan, examples being to show individual production teams or particular sections of work or specific locations, just to mention a few of the possibilities.
Tailored layouts can also be prepared for progress tracking. Individual work faces, or even individual trades can have specific layouts created showing clearly how actual progress compares with the plan.
Schedules with Impact
Compensation Event and Claim submissions can benefit greatly with time chainage charts. They can show the impact of a change or delay very clearly, making the argument for you. If you are using TimeChainage and have been inputting actual progress, then all the data is likely to be in the TimeChainage project file already. This means very little extra work is required to present a very convincing programme argument for your claim.
The Main Functions of TimeChainage
TimeChainage could be said to have three main primary functions, Planning, Progress Tracking and Presentation.
Planning
Unlike bar chart style project management software, TimeChainage will calculate the duration of linear activities based on length and production rate. The user inputs start and finish locations, progress rate, logic links and any constraints, TimeChainage will then calculate start and finish dates and duration based on user-defined calendars using the critical path method.
Activities can be grouped and sorted with a Work Breakdown Structure and Activity Codes. This provides a logical and convenient way to plan and display your project. This concept provides a lot of flexibility so you can plan the way you want to and along with filters and user defined layouts, you can present the information in many different ways. For example, whole projects or sectional plans can be shown, or work carried out by specific resources.
TimeChainage is great for creating “What if” scenarios and the output is superb for team discussion. People around a table can review and discuss the merits of options when they are presented in time chainage format far more easily than if they are in the form of Gantt charts.
TimeChainage can be used for planning entire projects or just those elements of work that have a linear or repetitive nature.
TimeChainage can be used on its own as a stand alone planning application or alongside a gantt chart package as a complimentary planning and forecasting tool.
Progress Tracking
Plotting actual production on a time chainage chart is a superb graphical way to track progress relative to the original plan. You can instantly see not only whether the project is ahead or behind and by how much, but also whether you are gaining or losing ground on the original plan. Actual progress is plotted alongside the planned programme and actual ‘rates’ of production can be compared visually with planned rates. TimeChainage allows progress to be added in any time period you wish, from one day upwards.
As time chainage charts are two dimensional, they show more information than a bar chart (which is really one dimensional). Relative progress rates can be easily seen, problem areas where two tasks are in the same place at the same time are easily identified and completion dates can be forecast using the actual progress to date and current ideas on planned production rates.
TimeChainage keeps the full history of actual progress along with your original plan (or plans) in a single project file. Planned and actual progress information can be exported quickly to a spreadsheet for further analysis if required.
A time chainage chart is a powerful tool for demonstrating the nature and quantity of delay. As such they can often be used alongside gantt charts for compensation event/claims submissions.
Presentation
For appropriate types of project, the time chainage chart provides a clearer more easily understood picture of the plan than a bar chart because it has a more graphical nature. Because of its two dimensional structure (time and distance), progress rates are shown by the slope of the activity lines and these can be compared with different tasks or between planned, actual and forecast.
Activities can be shown as either lines, bars or boxes and you can use different line styles, colours and hatching to distinguish between different kinds of activity.
A user defined Work Breakdown Structure (WBS) and Activity Codes can greatly help organise your project and can be used for sorting, grouping, filtering and displaying information in different ways.
Very complex projects can be displayed on a single chart and still provide a clear picture of the scheme.
Charts can be zoomed in or out to show specific areas of interest or filtered to show just specific work elements.
A great advantage of TimeChainage is that it shows true progress rates on the chart by taking full account of weekends, holidays, stoppages and any other non-work periods.
Baselines can be saved and displayed either on their own or together with the current plan for comparison purposes.
Annotation can be added to the chart, and various options for adding text and pictures to the chart are available.
Holiday periods can be shown with user defined hatching
A data date line with user defined text can be shown.
Date and Chainage Milestones can be added to highlight specific events or locations.
Various header options are available, including Title box, Revision box, Legend and you can also include a logo.
A picture, CAD drawing or schematic can be printed across the top of the chart and a tool for creating schematics is included in TimeChainage.
To enhance the looks of a chart, a background image or colour can be selected, the chart size and shape can be modified and the axes and grids have comprehensive formatting options.
Chart layouts can be saved. This gives you the ability to quickly change between say a print layout and a screen view layout, or between an overall view and a zoomed view, or between different filtered views.
A time chainage chart can be a very powerful reporting tool to help explain a plan, or show progress to the Project Manager or Client. And when changes are required, these can be easily and quickly incorporated and shown against the original plan to highlight where the changes are and what the impact is.
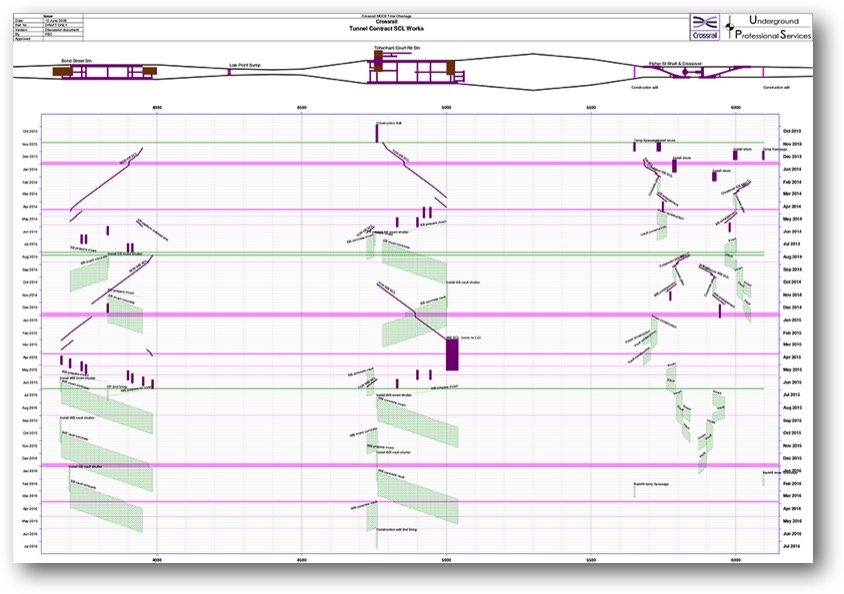
What is a Time Chainage chart?
The time chainage chart (also known as Diagonal Line, Time Distance or Time Location) is an extension of the Gantt bar chart known to all planners and project managers.
A bar chart uses the horizontal axis to represent time, so it displays each activity as a simple bar showing the start and end date. Nothing about an activity’s location or progress rate is shown by the bar. Any potential conflicts are not easily identified in this kind of chart.
Providing more information about each task, the time chainage chart uses the vertical axis as well as the horizontal one. This allows location and progress rate information to be introduced. The usual format for time chainage charts uses the x axis for location (or chainage) and the y axis for time. So for a linear type task, a diagonal line will be produced indicating not only start and end date, but also start and end location (chainage) and the slope of the line will indicate progress rate.
A great advantage of the time chainage chart is that even a large and complex project can be represented on a single sheet.
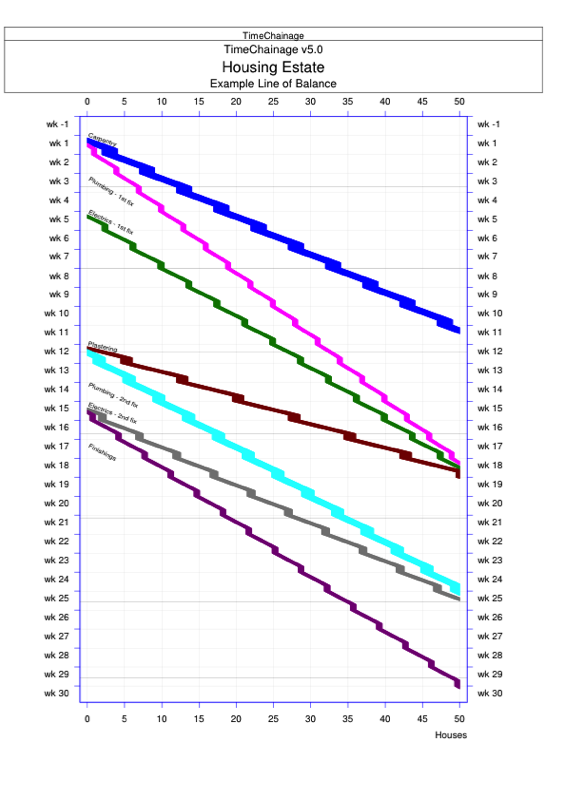
What is Line of Balance?
Line of Balance is very similar to Time Chainage except that instead of showing time against distance, it shows time against production units. The real benefit of Line of Balance is to help determine the best time to start consecutive trades or work packages to ensure that no clashes occur.
Line of Balance can be very effective for repetitive tasks that are not necessarily linear in nature. Typical projects suited to the Line of Balance method are:
TimeChainage is ideal for planning with the Line of Balance method. It makes the process very easy and straightforward and of course there are all the progress tracking and charting options that are available for the time chainage method.
Line of Balance can be very effective for repetitive tasks that are not necessarily linear in nature. Typical projects suited to the Line of Balance method are:
- housing estates
- high rise buildings
TimeChainage is ideal for planning with the Line of Balance method. It makes the process very easy and straightforward and of course there are all the progress tracking and charting options that are available for the time chainage method.
Hardware and Software Requirements:
No special hardware is required, TimeChainage should run on any standard PC running Windows.
Contact us for more details and a quote.